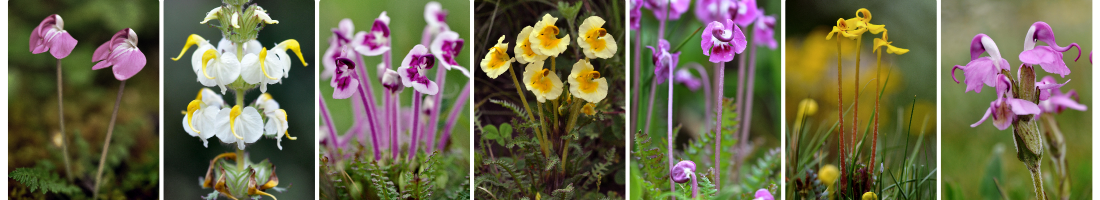

Vibgrant
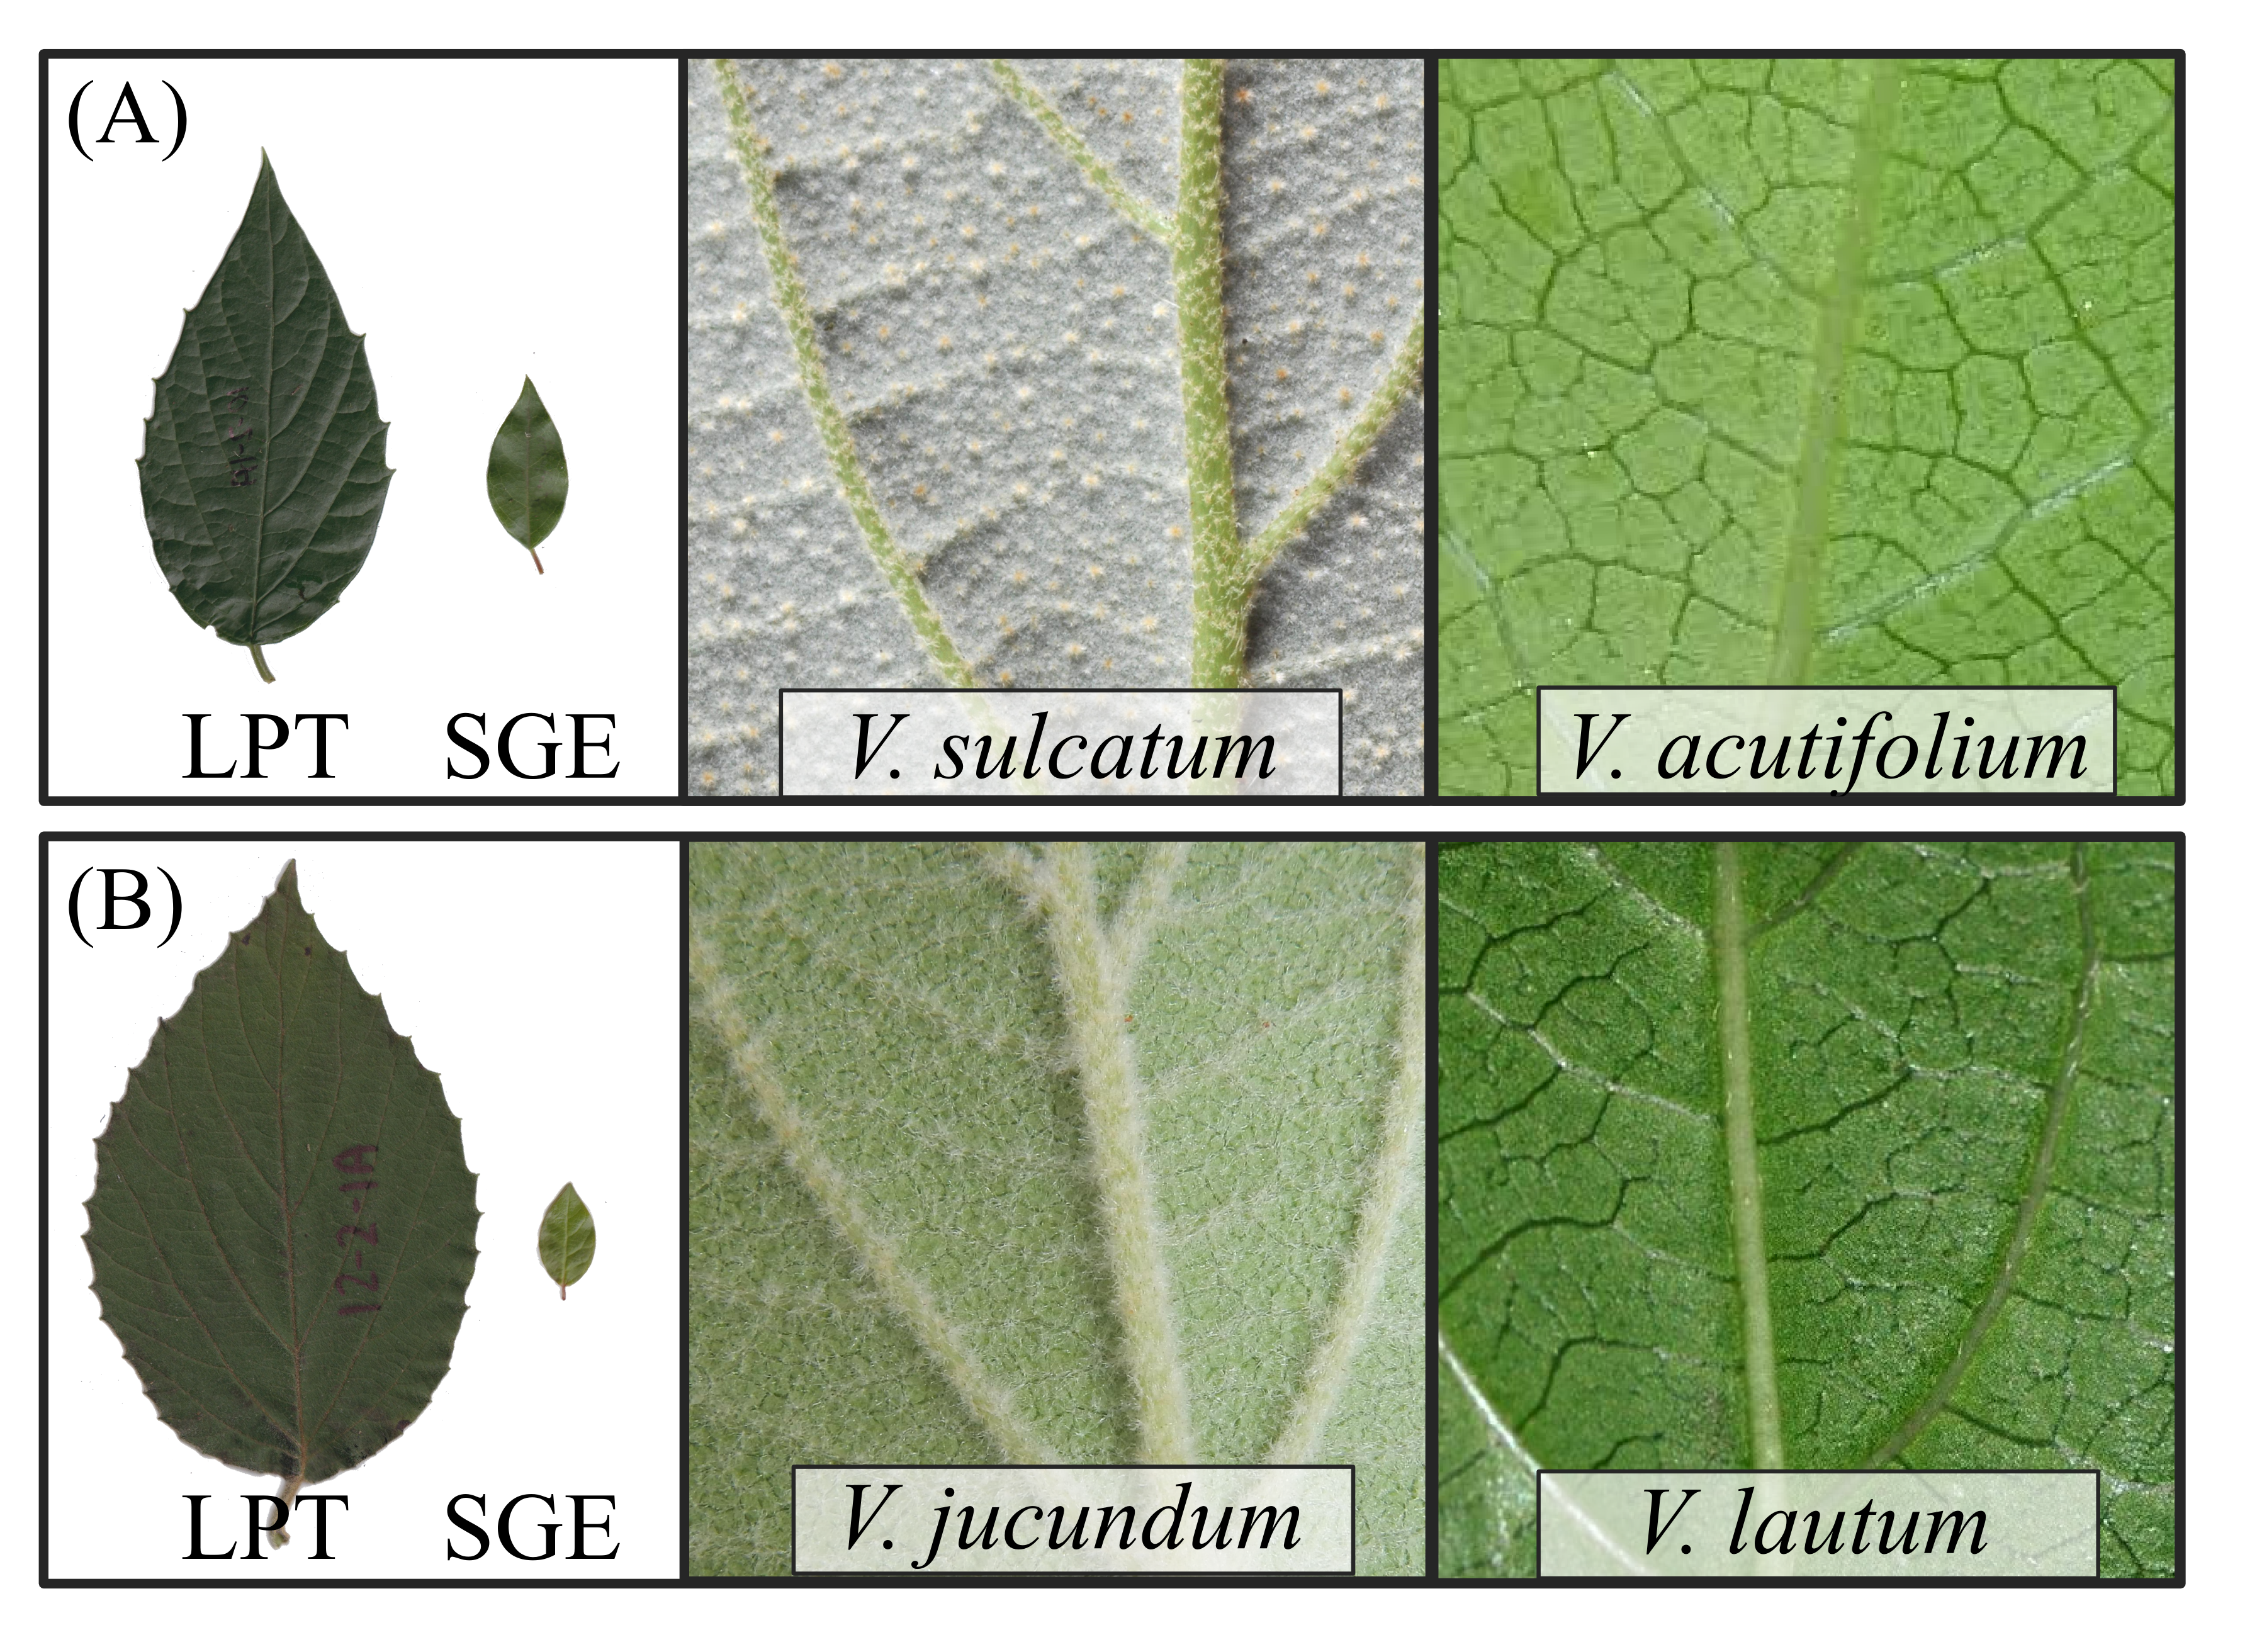
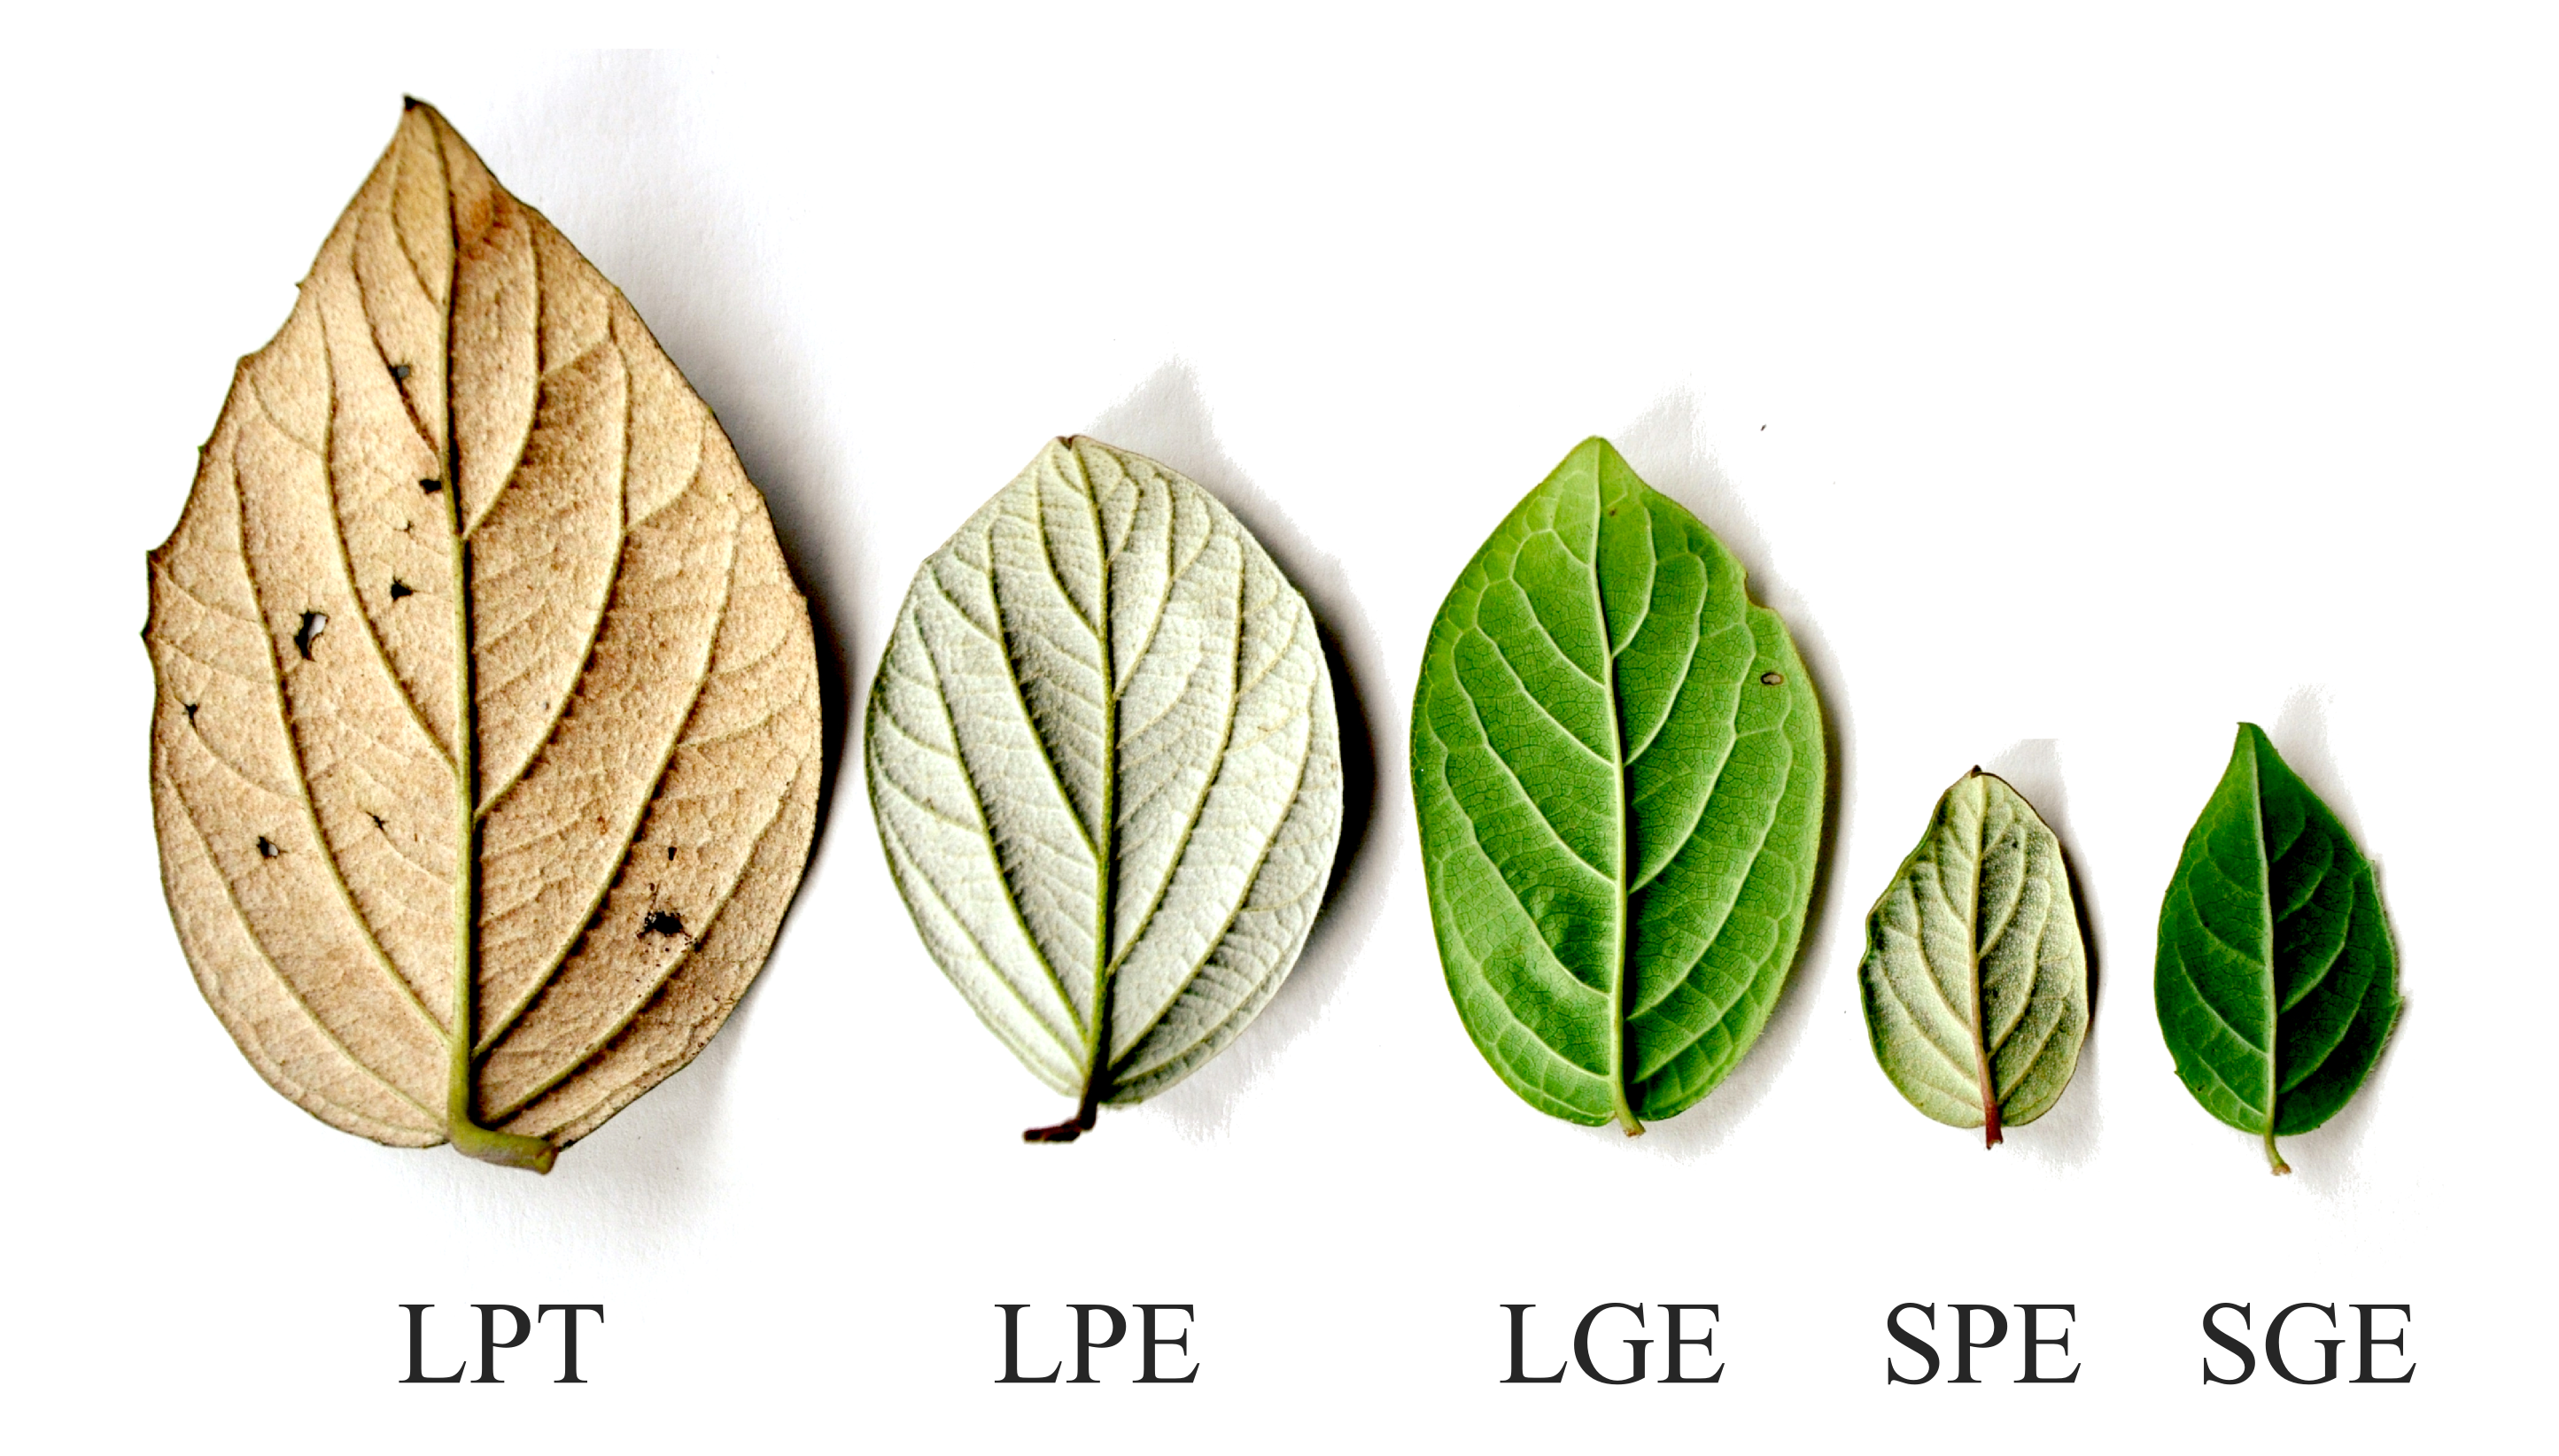
Figure_1 (PNG) – contrasting leaf forms, sems, hairs, histograms.
Figure_2 map and hypotheses (PDF) (EPS)– A map showing the two original divergence hypotheses. Orange indicates areas where we will focus our collecting efforts, green area will be examined in the context of phylogeny using samples from herbaria.
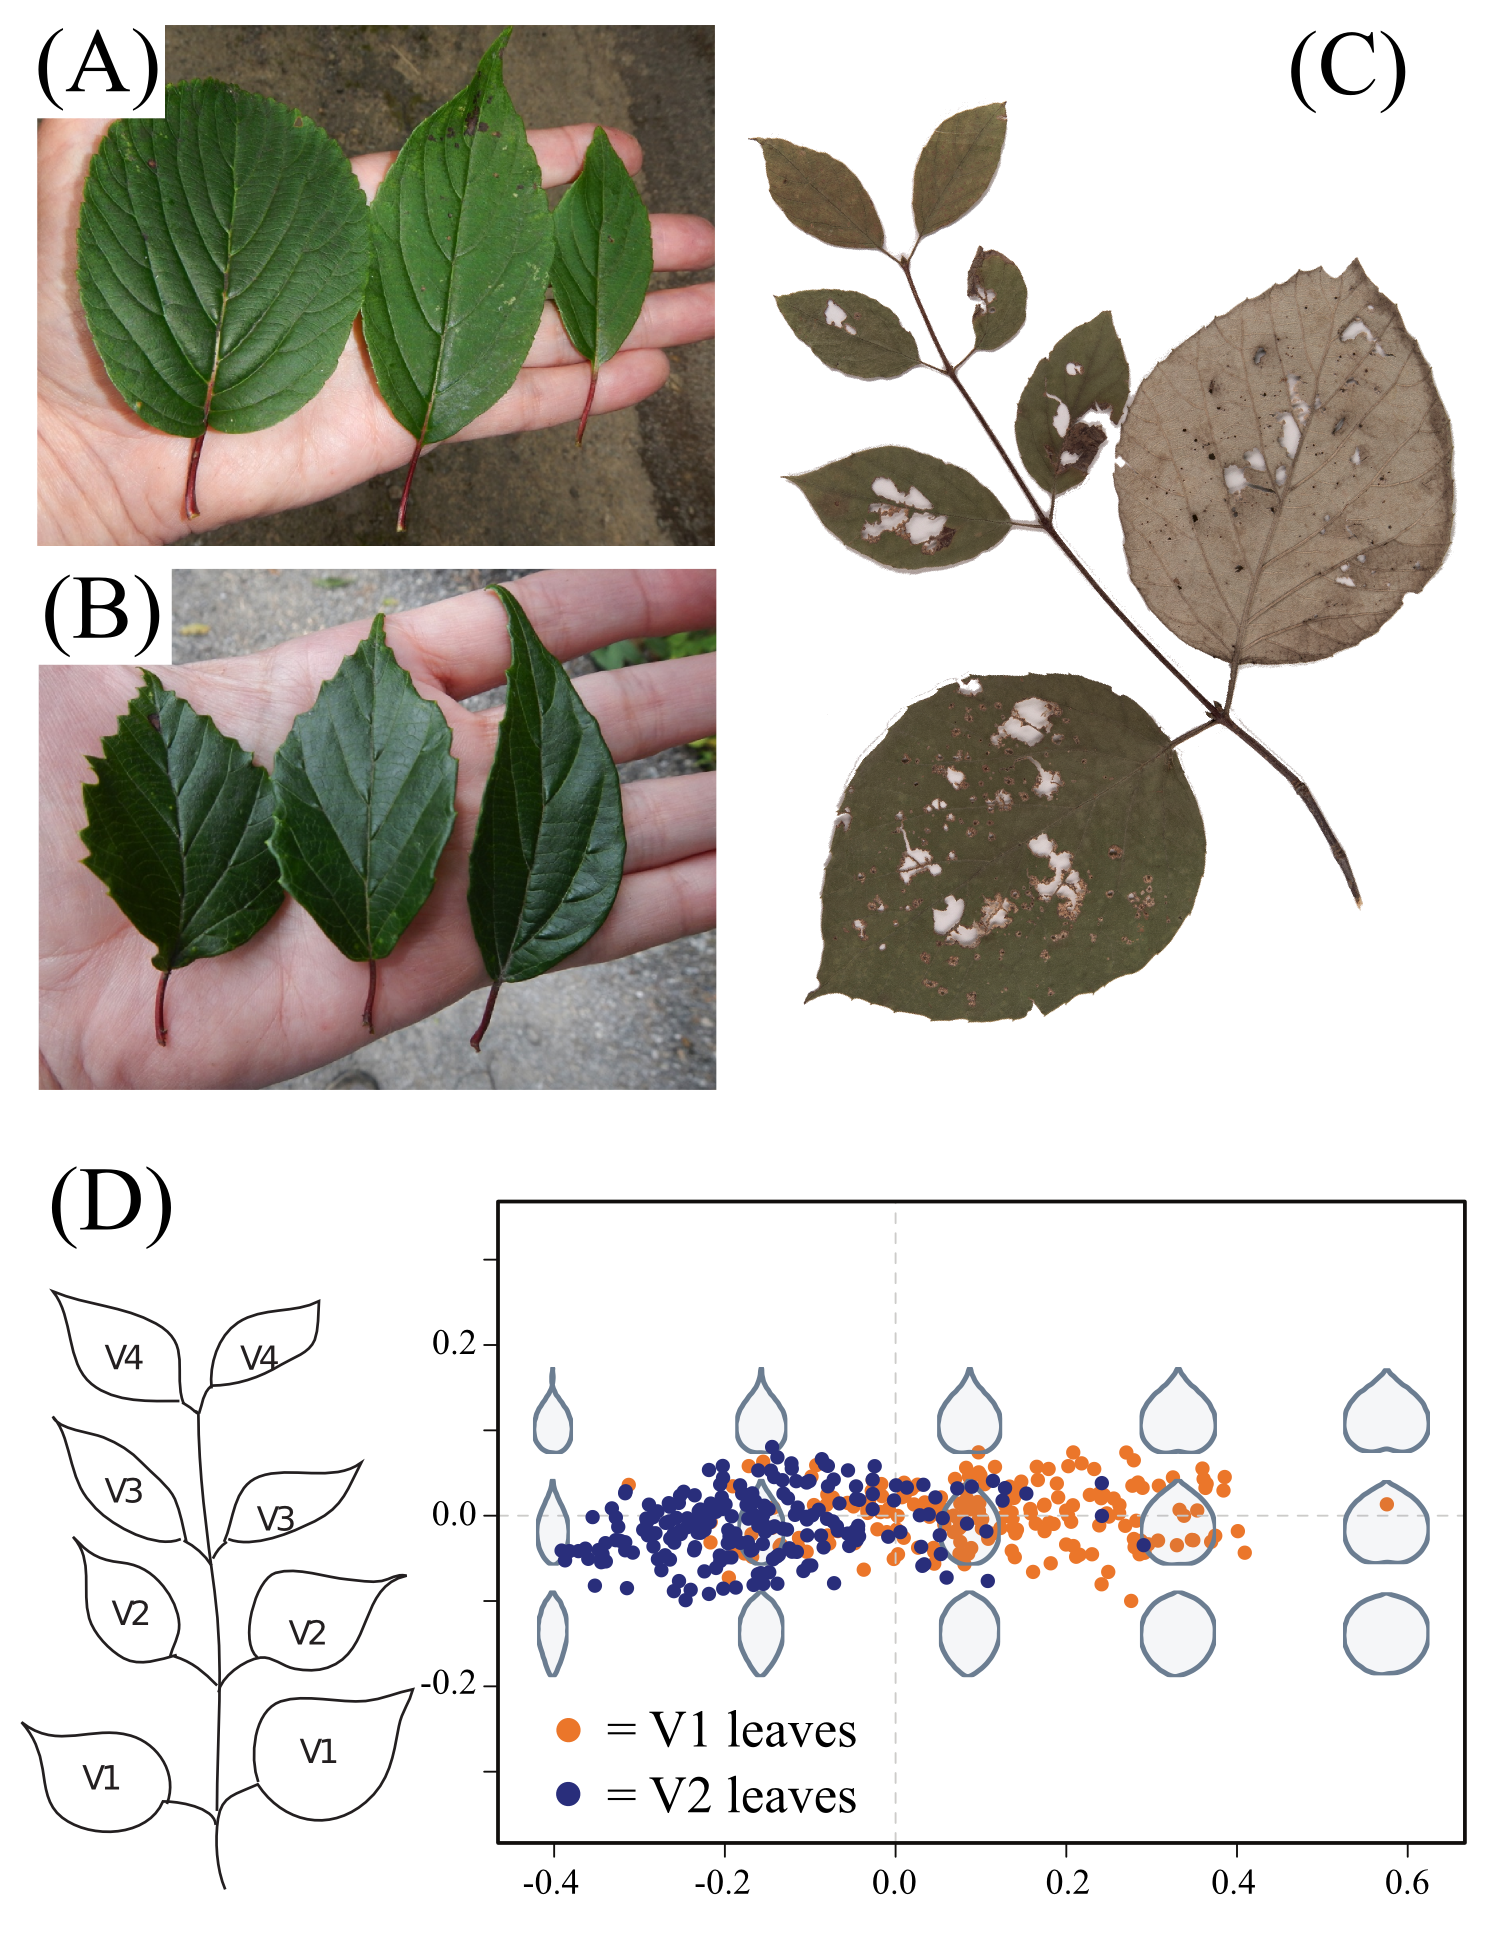
Figure_3 heteroblasty : Heteroblasty in Viburnun, microcarpum, and Spriggs figure.
Figure_4 hybrids (PDF) (PNG): Recombinant phenotypes seen in hybrids.
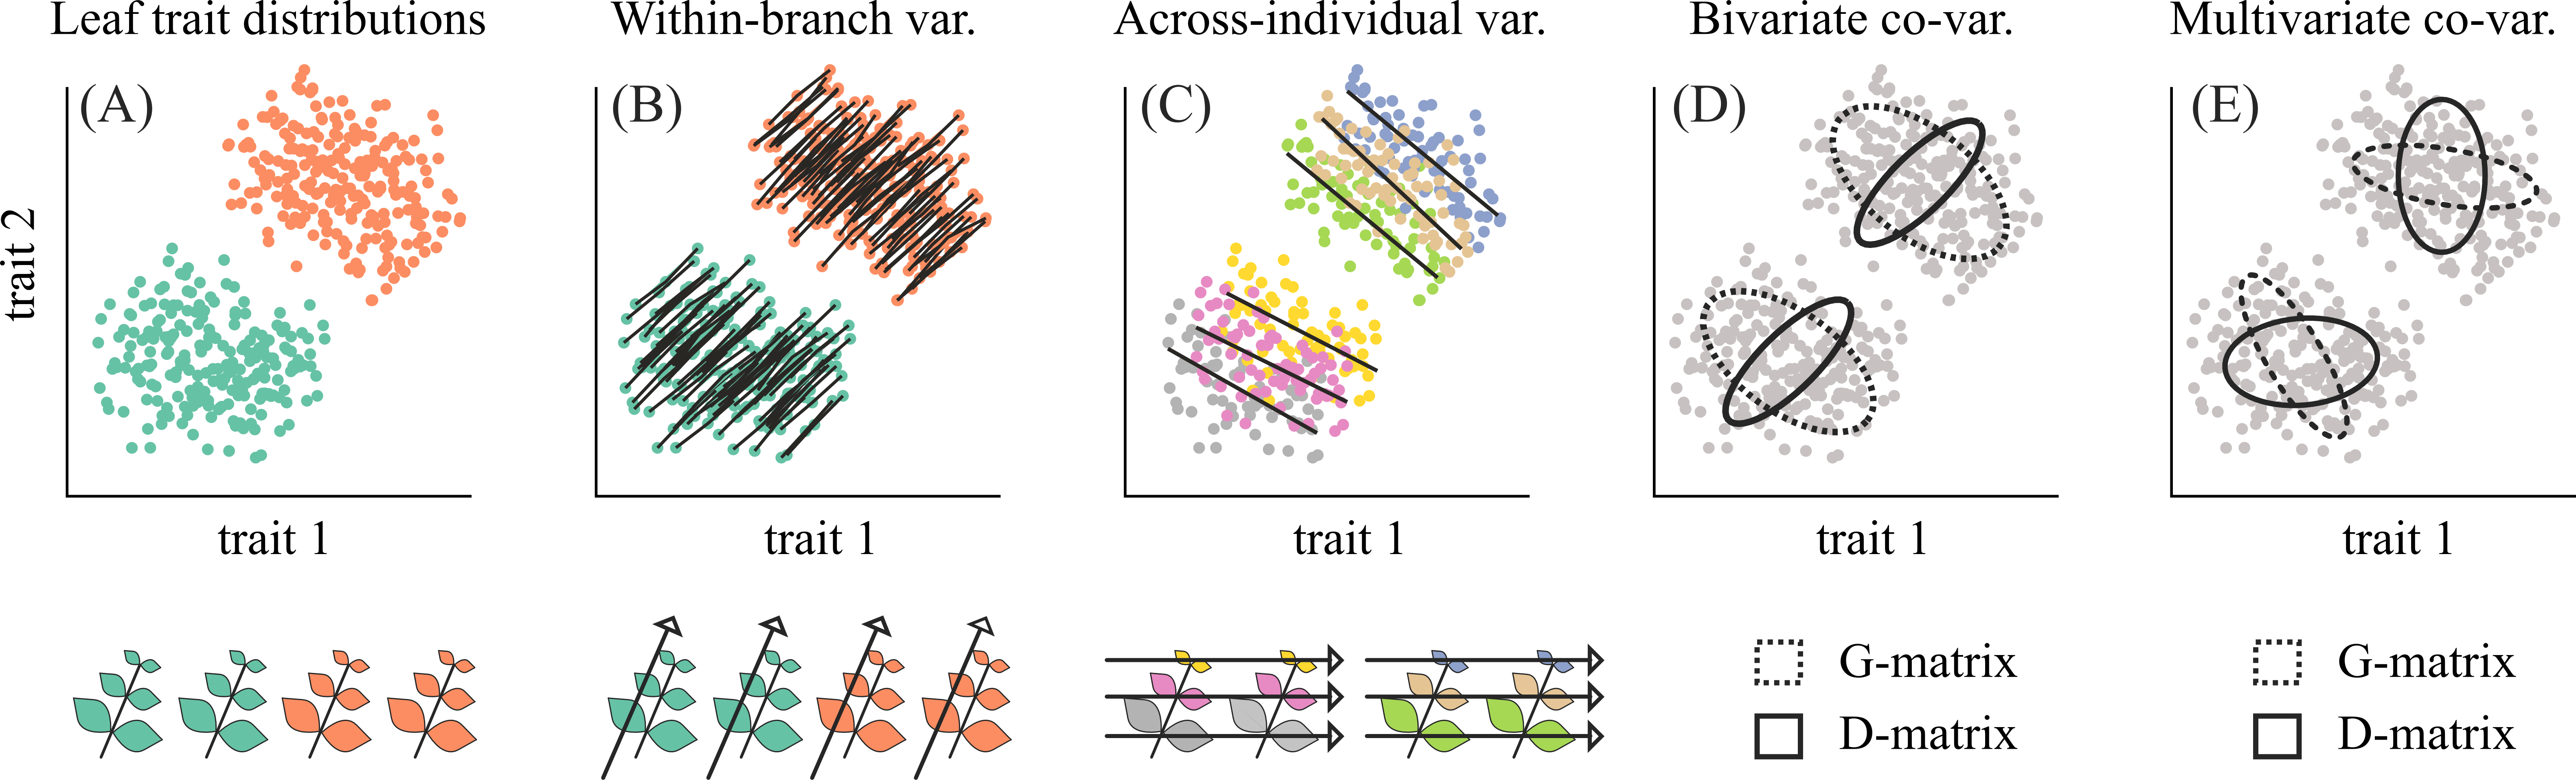
Figure_5 Ellipses in theory (PDF) (PNG) : Expectations and explanation of VCV matrices.
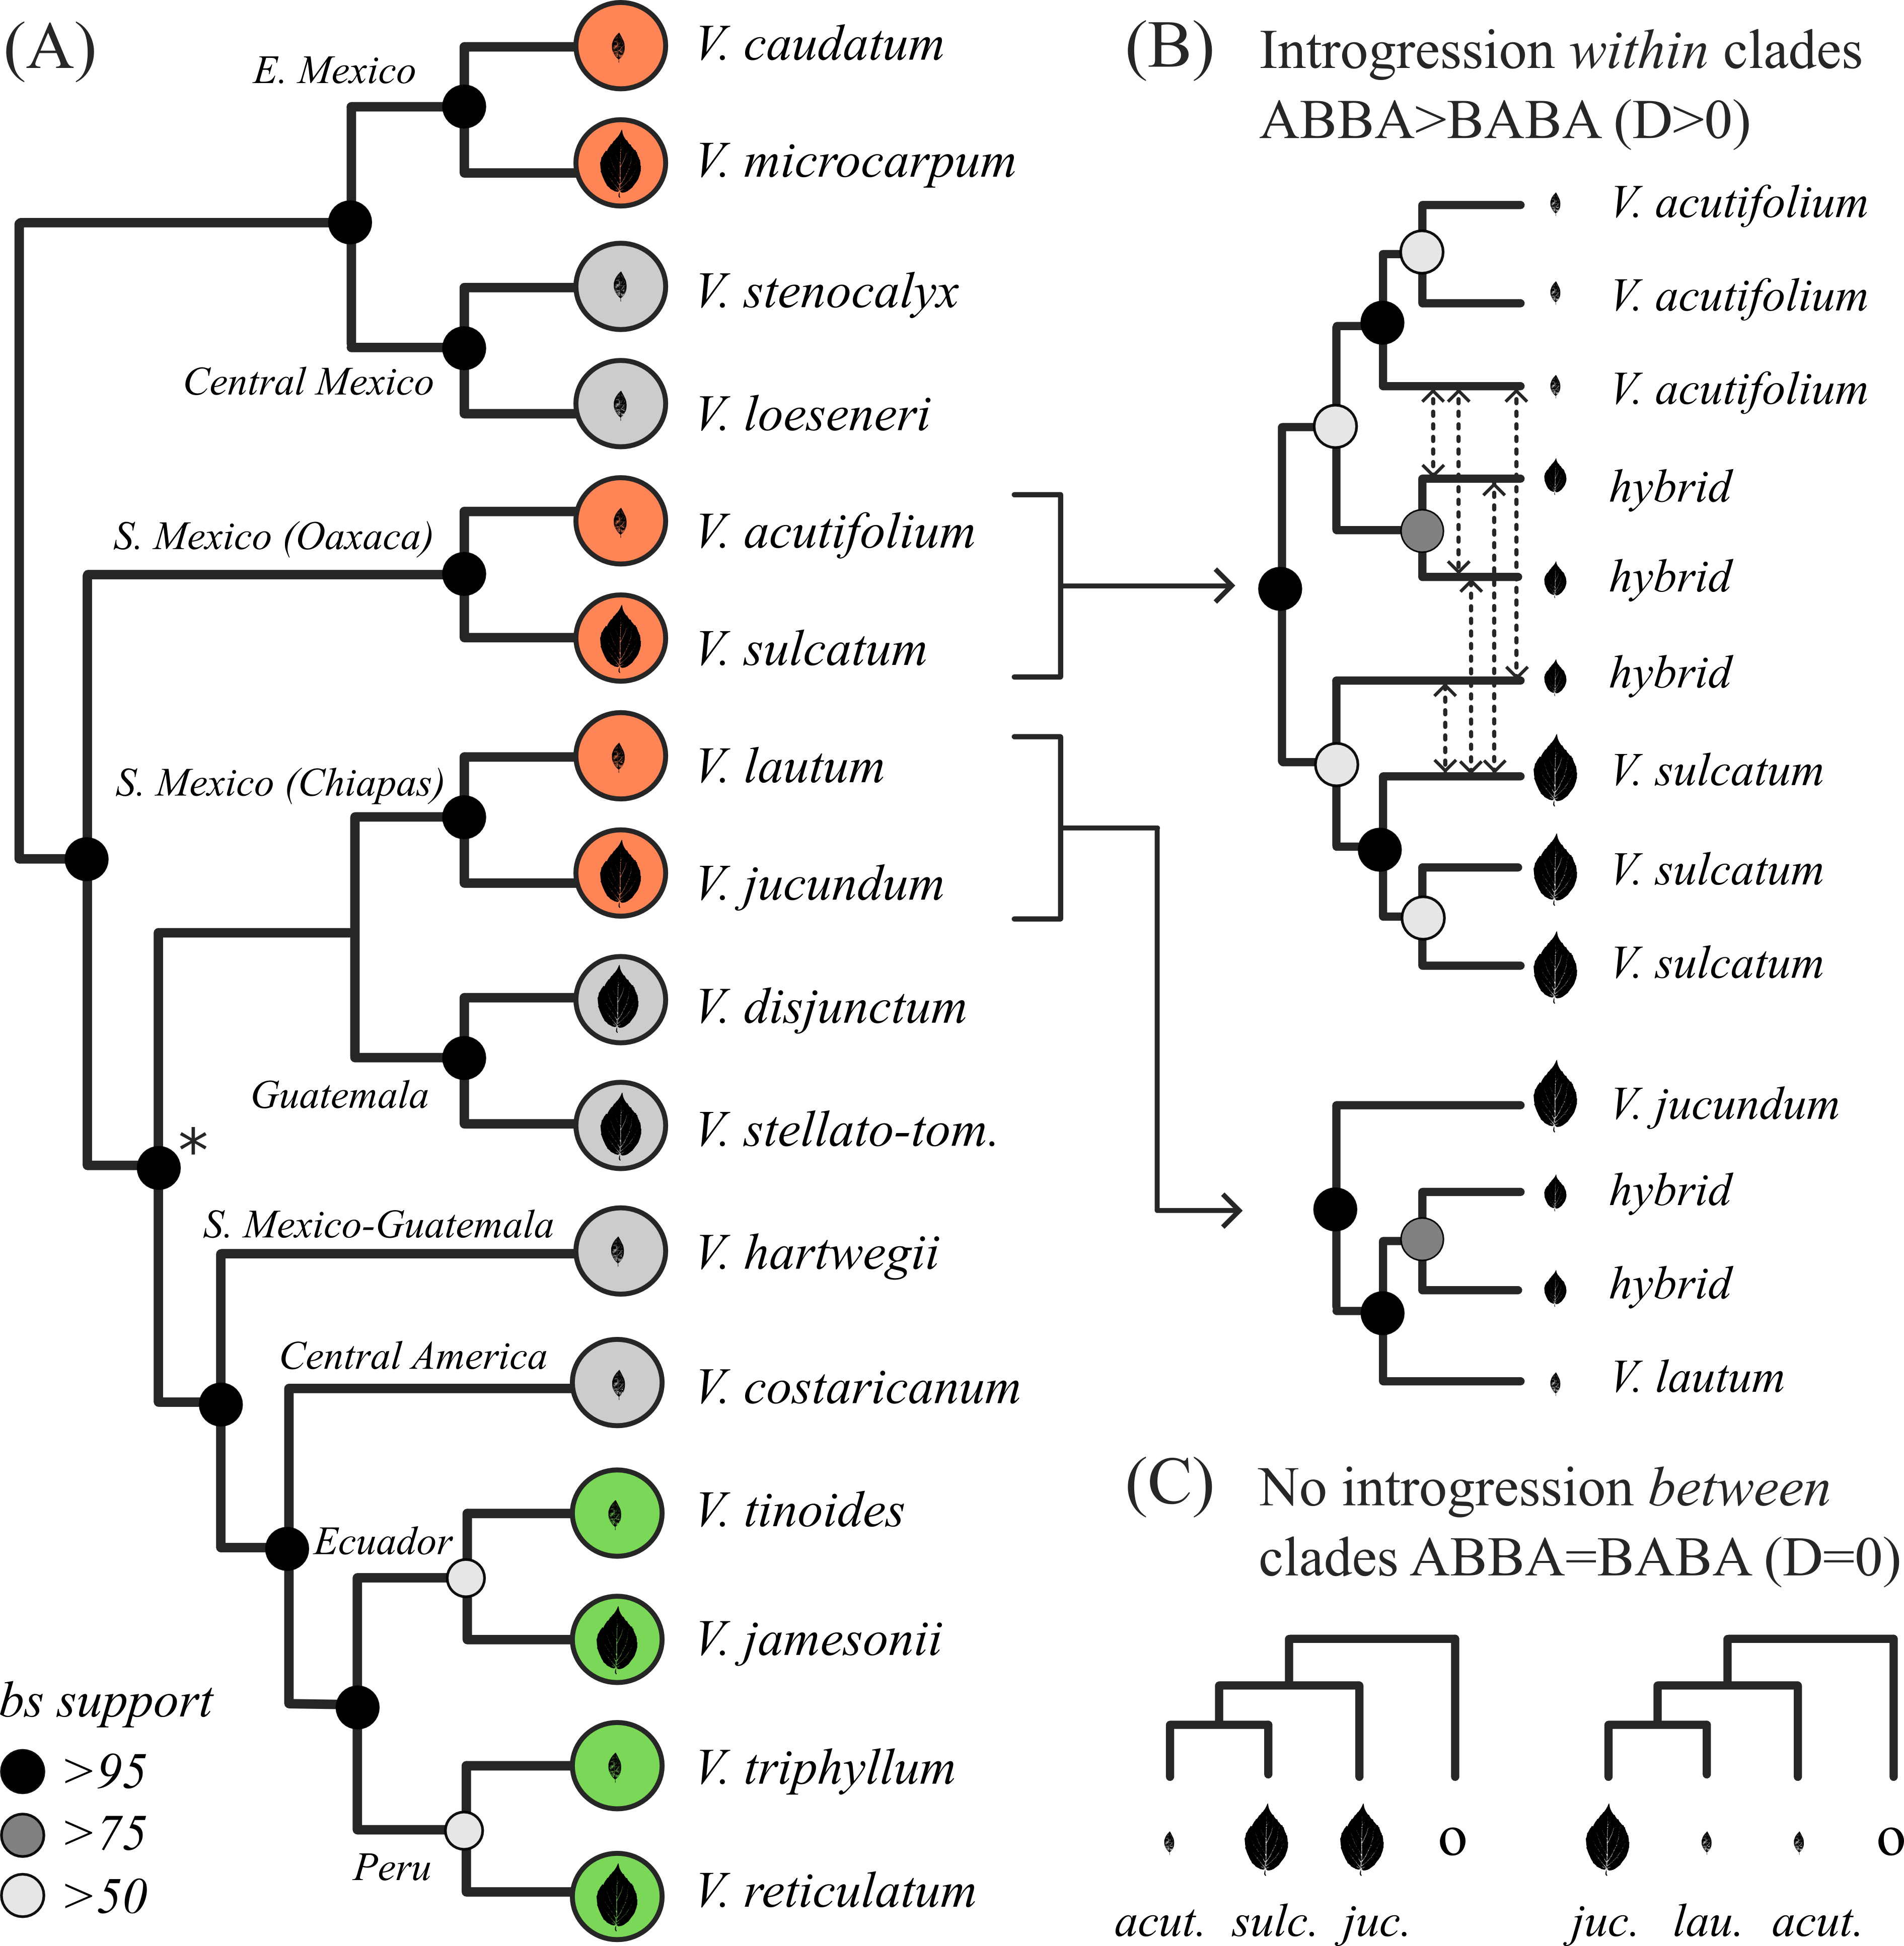
Figure_6 RADseq tree & ABBA-BABA (PDF) (PNG – Our RADseq phylogeny for 16 species in Oreinotinus. The tree supports replicate parallel leaf divergences. (B) Morphological hybrids sampled where sister-species co-occur show genomic evidence of admixture (ABBA>BABA). (C) Introgression between lineages from adjacent regions is not supported, which provides further support that our phylogeny is correct and does not simply reflect recent gene flow.
Figure_6 with hybrid photos
Figure_7 Cross section environment) (EPS) Cross-section through Oaxaca and Chiapas with PCA environment and aerial light capture.
Figure_8 – Empirical G/D matrix, and variation.
[Figure_9] – seedlings.
[Figure_10] – Timeline.
Development line plots (main pops), (Full_D_alt.html) : Developmental variation in jucundum (PN) and lautum (Teo; subsampled first 300 branches). Each point represent the mean leaf morphology in the first leaf pair (V1) of a branch and a vector is drawn from there to the mean leaf morphology at the last leaf pair sampled in that branch.
Across-individual V1 line plots (all pops), (V2s) : Here lines connect mean V1 leaf values across branches from the same individual. The lines thus show variation within individuals at developmentally homologous leaves (devologues?) and any apparent pattern of parallel lines across branches would represent the across-individual direction of variation. The third panel shows the mean V1 values of each individual, and thus the across-individual patterns.The V2s show the same across-individual variation as V1s!
Fig. 15 – Trait histograms : Histograms showing diffrences in leaf trait distributions between species.
Scatterplots : Bivariate scatterplots showing the distribution of leaf trait values between species.
Scatterplots x Pop : The same as above but with each population highlighted.
Scatterplots x Leaf set : The same as above but with each leaf tier highlighted.
Fig. 6 – Empirical ellipse : Coming soon…
Ellipse demo
Ellipse_demo2
Ellipse_test